Live queue monitoring
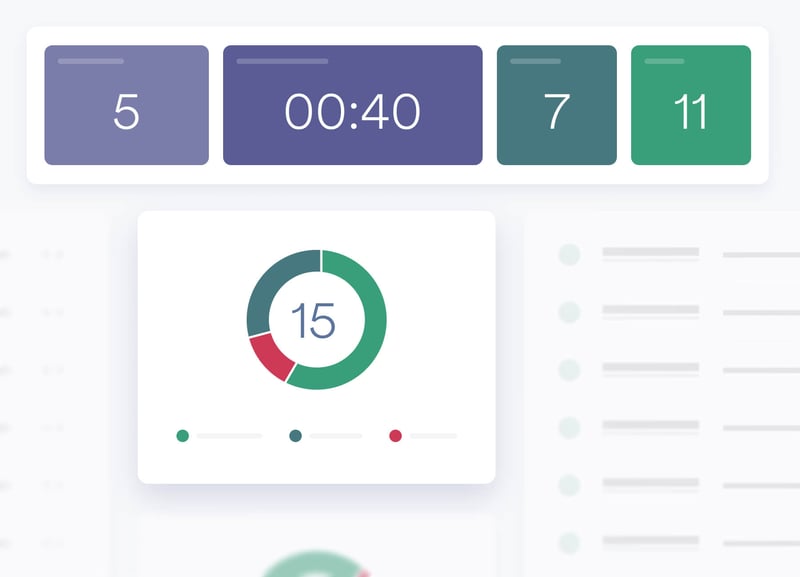
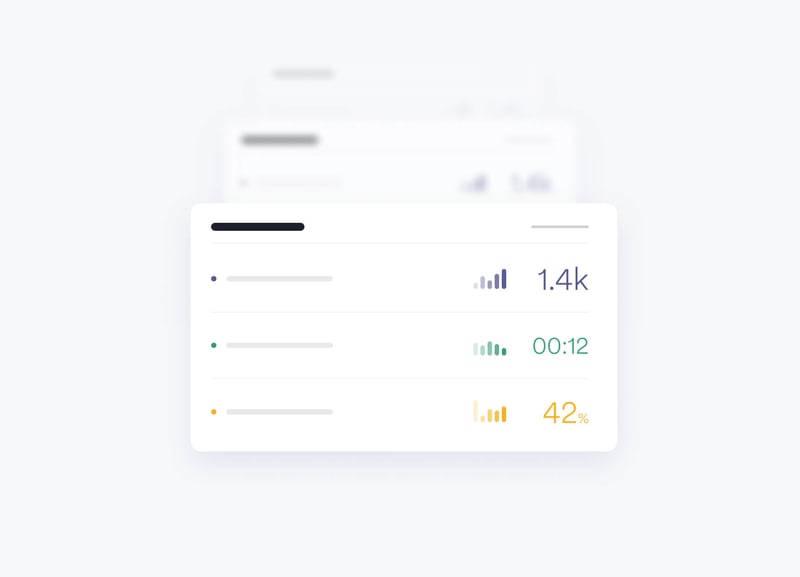
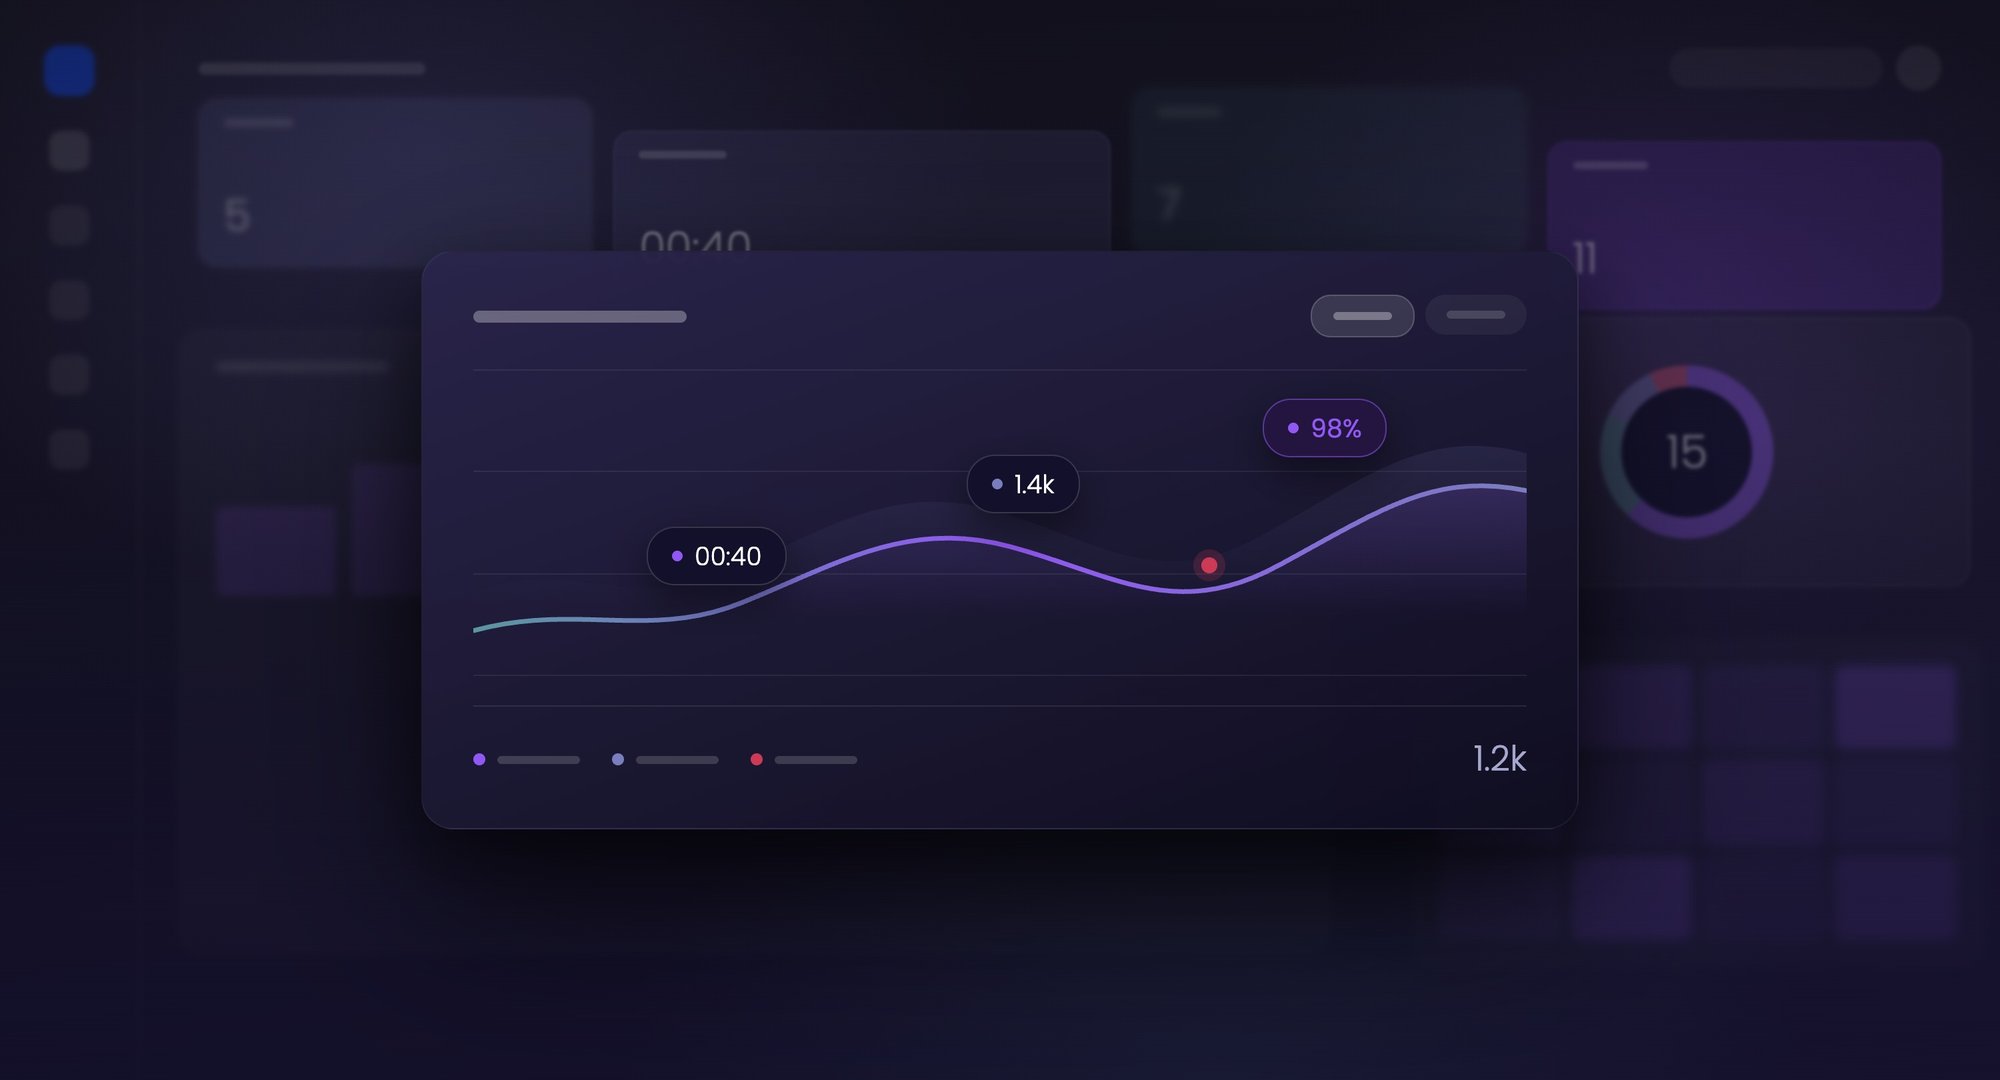
Monitor incoming call volume, agent availability, and queue depth in real-time. Supervisors track peak hours and staffing needs instantly through customizable dashboards, eliminating guesswork from workforce decisions.
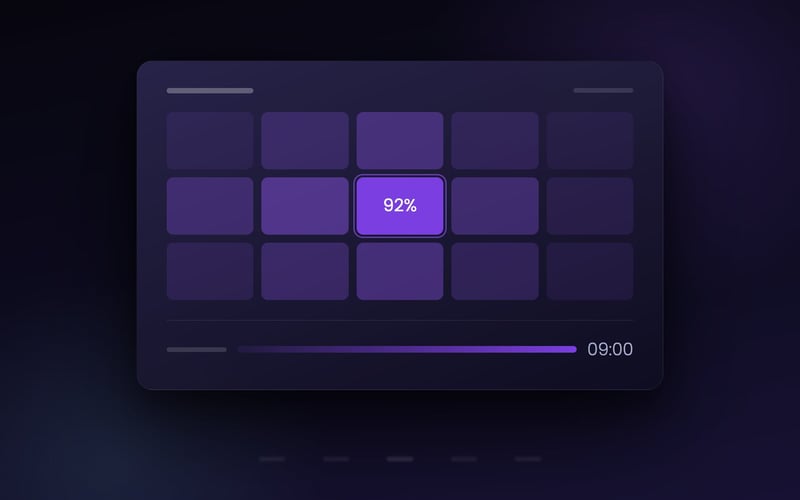
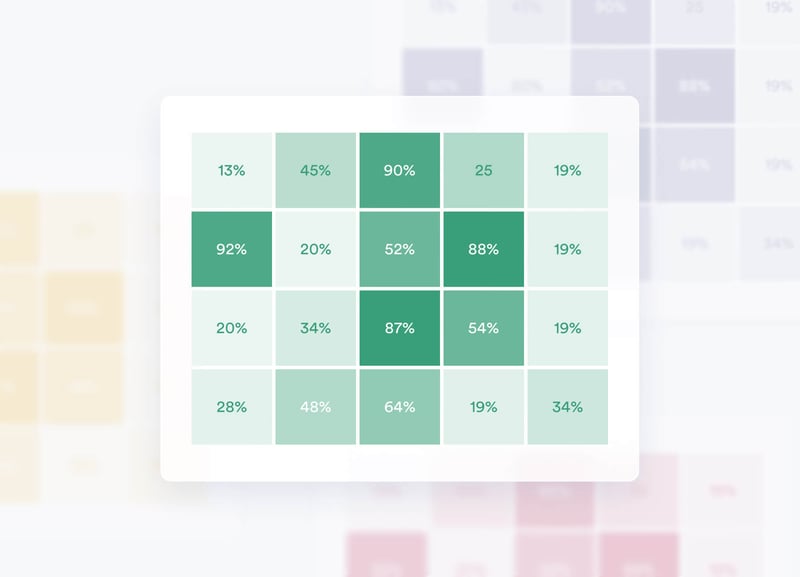
Visualize when calls concentrate—mornings, evenings, or spread throughout the day. Allocate agents strategically to high-demand periods, reduce wait times, and right-size your team before disruptions occur.
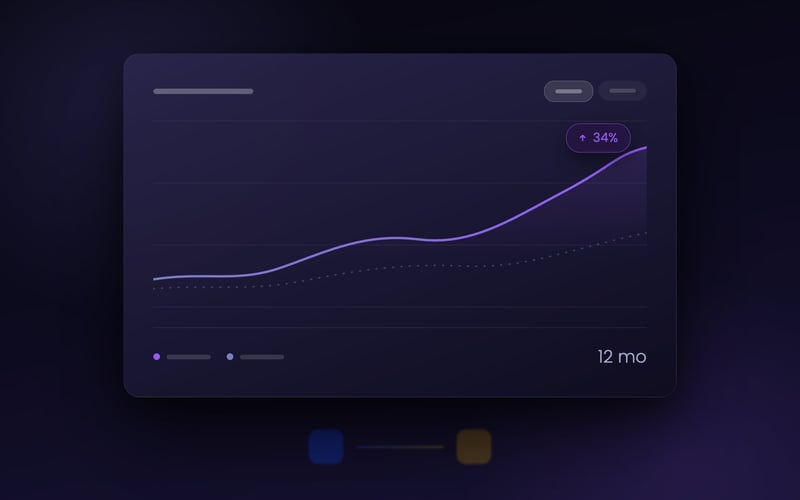
Connect Luware Nimbus to Power BI for deep-dive trend analysis. Uncover long-term patterns in call types, agent performance, and service levels. Build custom reports that inform staffing, routing, and operational improvement.
Your contact center runs 24/7, but visibility into what's actually happening often doesn't. You're staffing based on last week's patterns or your gut feeling about when calls spike—not real data. When unexpected call volume hits, you discover it only when your hold times climb and customers abandon.
You can't answer simple questions quickly: When do most calls come in? Which agents are handling the heaviest workload? Are we hitting our SLAs, or are we just hoping? Without a clear view of performance trends and real-time queue status, you're forced to react instead of plan.
Your team logs directly into Microsoft Teams, where Luware Nimbus operates as a native app. No new software to install, no login credentials to remember, no adoption training. Reporting is already where your team works.
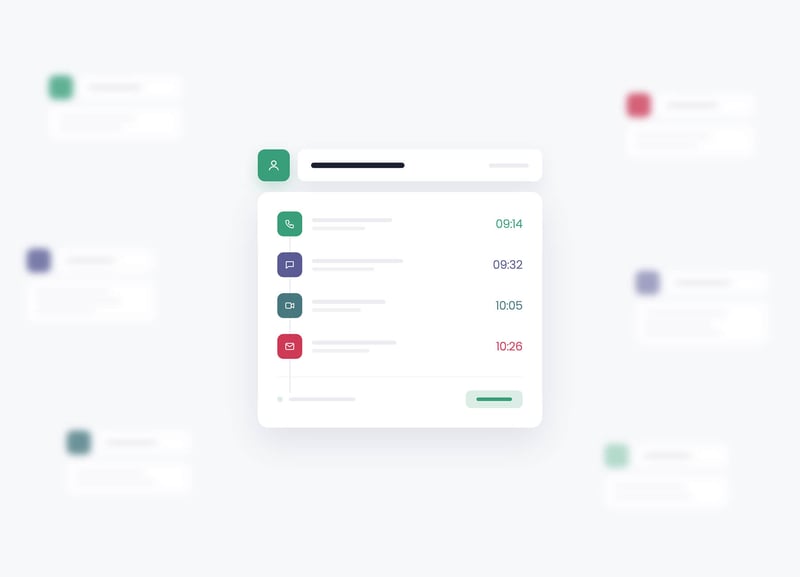
As every customer interaction occurs, Luware Nimbus logs it automatically in the background. Each call is recorded as a complete "Unified Session" with all relevant context—no manual data entry, no gaps in your visibility.
Open your Personal Dashboard or Live View widget inside Microsoft Teams. Real-time call volume appears instantly. You see queue depth, agent availability, and current workload. When a spike hits, you know immediately—not when complaints arrive.
Administrators assign specific "Reporting Roles" to team members who need to analyze trends. This role-based security ensures only authorized users access sensitive performance data, protecting privacy while giving managers the insights they need.
Data analysts connect the Luware Nimbus OData feed directly to Power BI. They pull historical data, merge it with other business systems, and build custom reports. Complex trend analysis and strategic insights emerge without manual data manipulation.
Monitor real-time call volumes, agent availability, and queue depth through customizable widgets built directly into Microsoft Teams. Supervisors make immediate staffing adjustments based on live data, not outdated information—reducing wait times and improving customer experience without context-switching to a separate tool.
Every customer interaction—across phone, chat, video, or email—is captured as a complete, single record with full context. This unified view eliminates data silos and gives you a complete picture of each customer journey, enabling better performance analysis and more informed routing decisions.
See exactly when your contact center is busiest. Heat maps display call volume patterns by time of day, day of week, or season, revealing when calls concentrate and when quiet periods occur. Armed with this data, you allocate agents strategically, reduce understaffing during peaks, and optimize shift coverage.
Administrators assign granular "Reporting Roles" that determine which Organization Units and datasets each team member can access. This security framework ensures sensitive performance data stays protected while giving managers and analysts the insights they need—supporting compliance with GDPR and local labor laws.
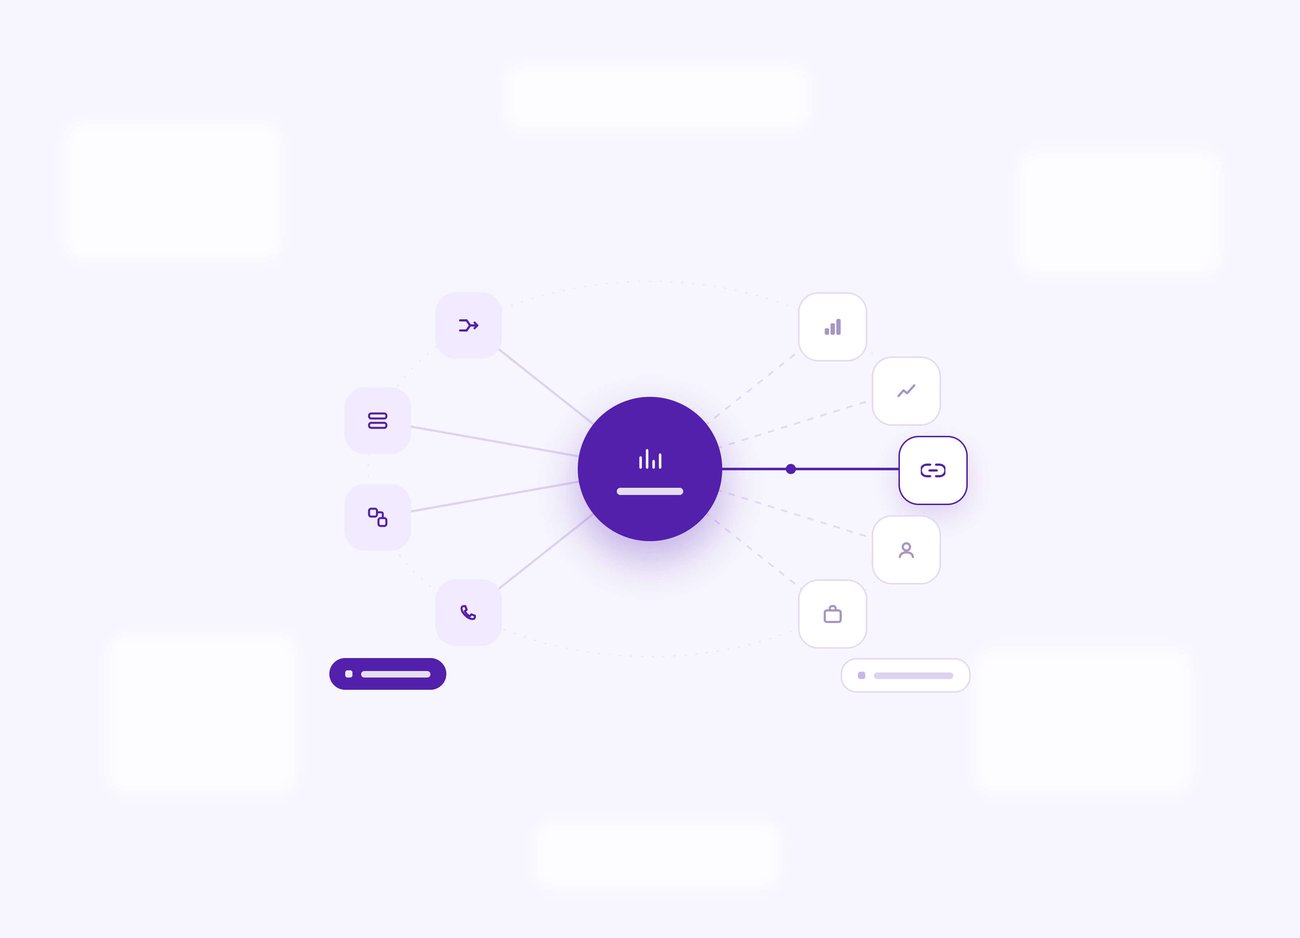
Connect Luware Nimbus directly to Power BI, Tableau, or any business intelligence platform via a standardized API connection. This open integration lets you merge telephony data with CRM, HR, or financial systems, building sophisticated cross-functional analytics without custom development.
Pre-calculated metric tables handle large datasets efficiently, eliminating the need for manual reporting or complex queries. Reports load faster, trend analysis becomes instantaneous, and your team can focus on insights instead of data processing.
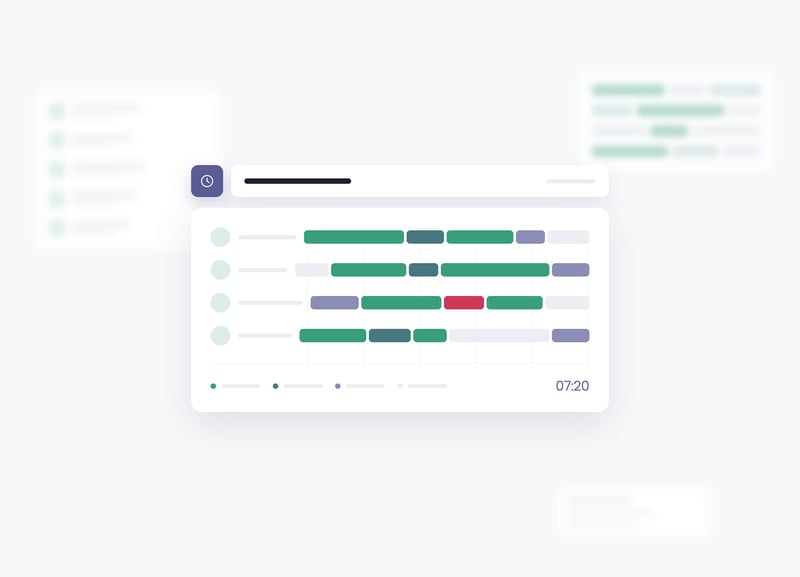
Track detailed historical records of agent availability—including After-Call Work, Connected/Selectable status, and Off Duty periods. Understand workload patterns, identify coaching opportunities, and optimize scheduling based on actual agent activity, not assumptions.
75%
of Luware Nimbus customers found the platform easy or very easy to learn.
This statistic reflects feedback from 52 Luware customers surveyed in June-July 2023 across German and English-speaking regions. For reporting and analytics features specifically, this ease-of-use finding translates into quick adoption of dashboards, rapid onboarding of new supervisors, and minimal training overhead. When teams can access live call data and historical trends without friction, they adopt data-driven decision-making faster and more consistently—reducing time-to-value and lowering organizational resistance to change.
Track detailed historical records of agent availability—including after-call work, connected/selectable status, and off duty periods.
Read the full story"We knew that most teachers would call the Education Services hotline during lunch, but the exact caller count remained elusive. Luware Nimbus has now provided us with comprehensive reporting on call volume with evaluations on busy times, wait times and missed calls. It has made workforce management much easier. We now see in real-time how many customers are calling and can add agents accordingly."
Read the full story"One thing I want to mention, which is truly important as far as our staffing goes, is being able to see the heat map. This allows us to see when calls are coming in – evenings, mornings, or spread throughout the day."
"The Power BI reporting with Luware Nimbus has given us valuable insight into the types of calls we're getting, enabling better service management. We have completely changed as an organisation, and our outlook on what is possible as part of a contact center."
Luware Nimbus relies on a strict Role-Based Access Concept (RBAC) combined with Tenant Data Privacy Settings to ensure historical data is heavily protected.
To even query the long-term OData feed, a user must be explicitly granted a "Reporting Role" by a Tenant Administrator, which immediately restricts their view to data solely within their authorized Organization Units. Furthermore, features that track granular employee metrics—such as User States Tracking—are locked behind Contact Center licenses and must be explicitly enabled at the tenant level to comply with local labor laws and GDPR. Ultimately, this means that organizations have granular control over exactly who sees what, ensuring that sensitive performance data never falls into the wrong hands.
Product Expert, Luware Nimbus
Martina Willig, Head of Presales at Luware, brings a Master's in Computer Science and 15 years of IT experience to her role. Drawing on her deep background in Microsoft technologies and IT consulting, she expertly bridges product capabilities with client needs to deliver tailored unified communication solutions that solve real-world operational challenges.
Reporting data feeds directly into Routing decisions—supervisors see real-time queue depth and adjust routing rules or agent availability instantly. Call Queues performance appears in dashboards, showing average wait times and abandonment rates at a glance. Workflow Editor automation can be optimized based on reporting insights; if data shows bottlenecks at specific steps, you refine workflows to eliminate delays. Attendant Console activity is tracked and reported, giving visibility into receptionist workload and performance.
The Luware Nimbus OData feed connects directly to Power BI and Tableau, enabling sophisticated analytics. Merge call data with your CRM system to correlate customer interactions with pipeline activity. Link reporting to your HR system to align agent scheduling with payroll and compliance tracking. Connect to your ERP to understand contact center costs as a percentage of revenue or customer acquisition cost. This open integration approach means you're never locked into a single analytics tool. Your data flows where your business needs it, creating a unified view of contact center performance across your entire organization.
Luware Nimbus provides a comprehensive suite of real-time dashboards, historical reports, and advanced analytics tailored specifically for the Microsoft Teams environment. You can track critical metrics ranging from live queue volumes and agent presence to long-term performance trends and data aggregations across your entire communication ecosystem. These detailed insights ensure that management maintains total visibility over service levels and can make informed adjustments to staffing or routing.
Contact center reporting and analytics help managers identify peak traffic hours and potential bottlenecks before they impact the customer journey. These insights allow teams to track critical KPIs, such as Average Handling Time (AHT), First Call Resolution (FCR), and Service Level Agreement (SLA) percentages, facilitating data-driven coaching and optimized staffing schedules. By surfacing these performance trends and real-time metrics within the familiar Microsoft Teams interface, Luware Nimbus ensures agents are supported, callers are routed efficiently, and overall call abandonment is reduced.
Luware Nimbus offers highly flexible, widget-based dashboards that allow you to visualize the specific metrics most relevant to your unique business goals. Users can monitor key indicators such as Average Handle Time and First Call Resolution through a customizable interface designed for quick data digestion. For more advanced requirements, a seamless Power BI integration enables the use of bespoke templates to perform deep-dive analysis into historical data.
Luware Reporting provides real-time visibility into call volume patterns and peak hours, enabling managers to optimize staffing schedules strategically. The heat map feature shows when calls are concentrated—evenings, mornings, or spread throughout the day—allowing you to allocate agents efficiently and reduce wait times during high-demand periods. By understanding these patterns, you can plan shift coverage in advance, respond to unexpected spikes in real-time, and ensure that your team is always right-sized for customer demand.
Luware Nimbus features a robust OData feed that connects directly to Power BI, allowing organizations to merge telephony data with existing CRM or ERP insights. This integration enables the creation of sophisticated, "pixel-perfect" paginated reports that can be automatically distributed to key stakeholders via email. By leveraging external BI tools, businesses gain a holistic view of their operations and conduct complex cross-functional data analysis.
All Luware Nimbus reporting and analytics data is processed within your trusted Microsoft 365 environment to ensure strict compliance with global standards like GDPR. You maintain full control over data residency and access permissions, ensuring that sensitive communication metrics never leave your secure ecosystem. Additionally, the platform provides the ability to anonymize personal records, effectively protecting the privacy of both your agents and your customers.
Core reporting functionalities, including live service statistics and team dashboards, are integrated directly into the Luware Nimbus Advanced and Enterprise routing packages. While basic visibility is included, extended historical analysis and advanced Power BI reporting capabilities require specific roles or a dedicated contact center license. This tiered approach allows businesses to choose the level of analytical depth that best aligns with their operational complexity and budget.
Book a personalized demo and see how the Luware Nimbus Reporting works inside your Microsoft Teams environment.
Manage inbound call volume with intelligent queuing that prioritizes and distributes calls automatically.
Manage inbound volume with intelligent queuing. Queue data feeds reporting dashboards.
Design call flows visually with no-code tools, no development required.
Markus Weisbrod
Head of Product Management, Luware Nimbus Last updated: July 2026