Customizable dashboards for instant insights and data-driven decisions

For true data-driven decisions, contact center supervisors need key performance indicators at a glance. Customizable dashboards offer instant insights into the central metrics of your contact center, track performance and show trends. In Luware Nimbus you can now create your own custom dashboards with a simple widget-based editor.

Why use a dashboard in the contact center?

“Customer service is usually one of the more metrics-driven departments in an organization,” states Forbes. As contact center managers strive to drive value in the contact center, they may utilize the vast amount of data that is collected every day with every call or interaction their departments handle. While certain KPIs certainly make more sense than others, generally, keeping track of performance, monitoring trends, and discovering issues is a data-driven approach to improve productivity, service quality and decision making.

Benefits of the Luware Nimbus Dashboards

The new dashboards in Luware Nimbus allow contact center managers to build their own overviews in a widget-based editor.
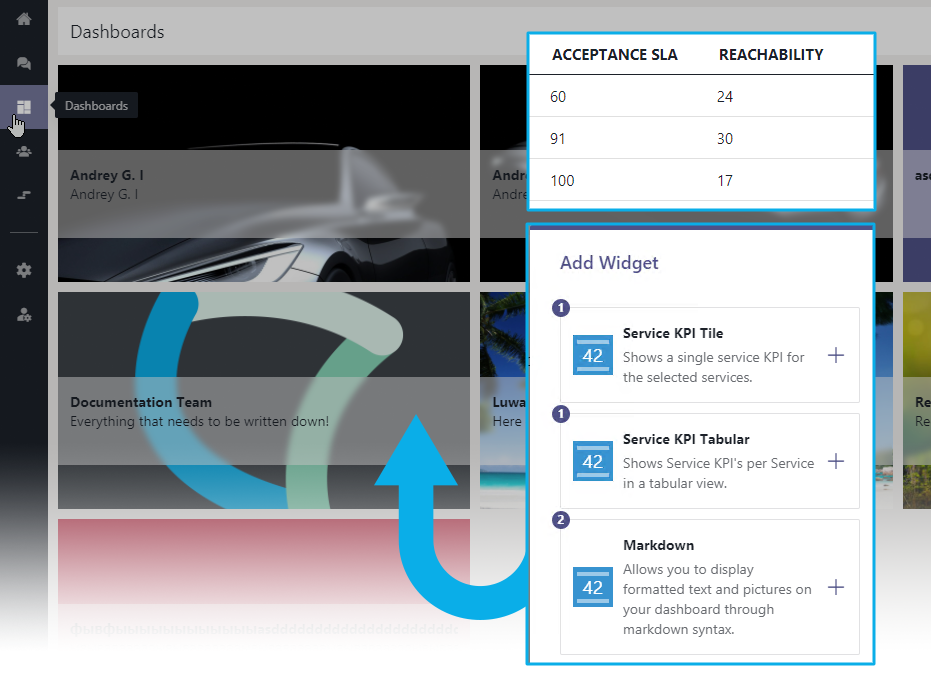
  • Dashboards for a specific service or across services
  • Widget-based with flexible canvas for fast and easy setup and change
  • Share dashboard link with colleagues
  • Set custom thresholds for each individual KPIs and warn with color and audio

A selection of Dashboards created by multiple users

What KPIs say about your service

Data is great – if we know what to do with it. Customers reaching out to your contact center have an issue that they usually couldn’t solve themselves using your website, self-service portal, bot, or FAQ. Here are some KPIs and what they might say about your contact center and how they might support you to create more value in your customer service.

  • Accepted interactions and reachability: Have customers actually come through to your agents? Customers calling the contact center are oftentimes impatient, annoyed, or stressed as they do have an issue that made them call you in the first place. Not getting through to your agents is not particularly good for their customer experience – which is crucial for their loyalty to your brand. The accepted interactions and your reachability (% of accepted interactions) are a good indicator of the customers’ experience of your service.
  • Hang-ups: When customers hung up on your service is a good indicator of why they did so. Metrics can help you here, for example, hang-ups in the IVR might indicate that the menu didn’t cover the issue they had, hang-ups in the queue probably means that they lost patience because the wait time was too long, hang-ups after queue could mean your customers are willing to wait longer than your queue is currently allowing them to.
  • Callers in queue & queue time: Unless you have a very entertaining waiting experience, your customers probably don’t like to be in the queue. The number of callers in queue and their average queue (or wait) time probably predicts quite well which mood they will be in once they reach an agent. If your queue is constantly overloaded, then you probably are short-staffed. If you only have long wait-times during certain times of the day or week, you might want to inform your customers about quieter times in your IVR or have a few employees help out in peak times.
  • Average Connected time (also called Average Handling Time, AHT): This is one of the most popular KPI in the contact center industry – but not necessarily a very useful one. The AHT just measures the time the agent spent with the customer in one call. Many contact centers aim to reduce AHT, in the hope to reduce labor costs. However, it is important to remember that nowadays, customer calling your contact center often have complex problems. The simple ones could probably be solved themselves by using your website, FAQ, chat bot or customer portal. If your AHT is very short, then your agents might be answering questions that could have been automated. Most customers will favor short handling times themselves, but they appreciate it even more if their issue solved in one call (first contact resolution, FCR), rather than having multiple interactions with a short connected time. We recommend reading the AHT with a pinch of salt and only in combination with analyzing the inquiries that customers had.

Luware Nimbus Contact Center

The customizable dashboards are available in the module ‘Contact Center’ of our customer service suite Nimbus. The Contact Center module is targeted to organizations with a large-scale customer service center with the need for skill-based routing, after call work, and extensive reporting.

Discover Luware Nimbus Contact Center

Further readings

Stay Up to Date With Customer Service Trends