

Categories
For true data-driven decisions, contact center supervisors need key performance indicators at a glance. Customizable dashboards offer instant insights into the central metrics of your contact center, track performance and show trends. In Luware Nimbus you can now create your own custom dashboards with a simple widget-based editor.
“Customer service is usually one of the more metrics-driven departments in an organization,” states Forbes. As contact center managers strive to drive value in the contact center, they may utilize the vast amount of data that is collected every day with every call or interaction their departments handle. While certain KPIs certainly make more sense than others, generally, keeping track of performance, monitoring trends, and discovering issues is a data-driven approach to improve productivity, service quality and decision making.
The new dashboards in Luware Nimbus allow contact center managers to build their own overviews in a widget-based editor.
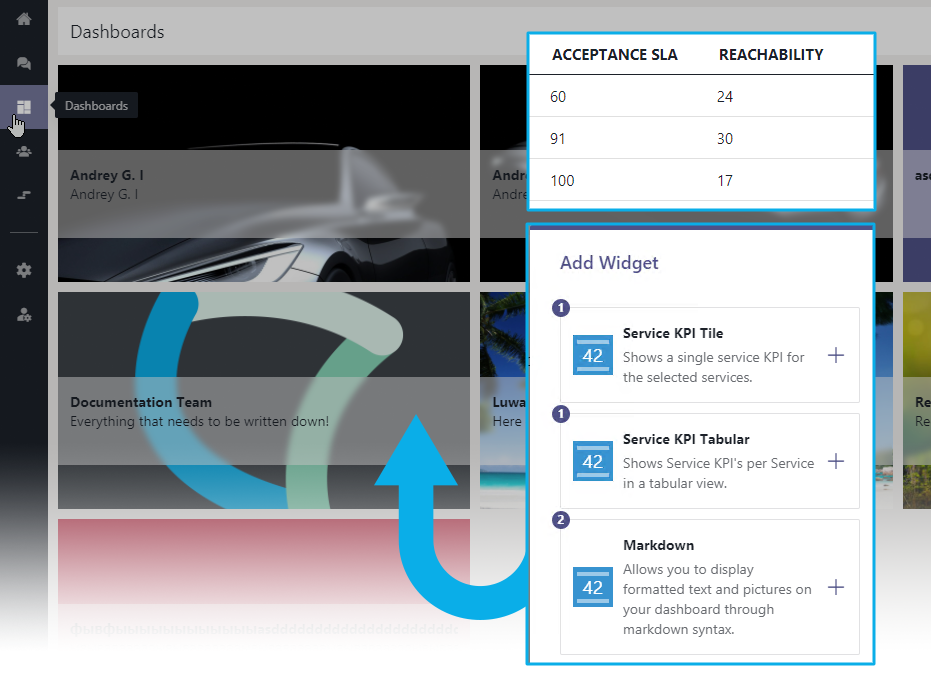
A selection of Dashboards created by multiple users
Data is great – if we know what to do with it. Customers reaching out to your contact center have an issue that they usually couldn’t solve themselves using your website, self-service portal, bot, or FAQ. Here are some KPIs and what they might say about your contact center and how they might support you to create more value in your customer service.
The customizable dashboards are available in the module ‘Contact Center’ of our customer service suite Nimbus. The Contact Center module is targeted to organizations with a large-scale customer service center with the need for skill-based routing, after call work, and extensive reporting.
Discover Luware Nimbus Contact Center